
|
|
|
|
|
|
|
JLB... a model by Jean-Luc BonnefoyAbstract of the paper
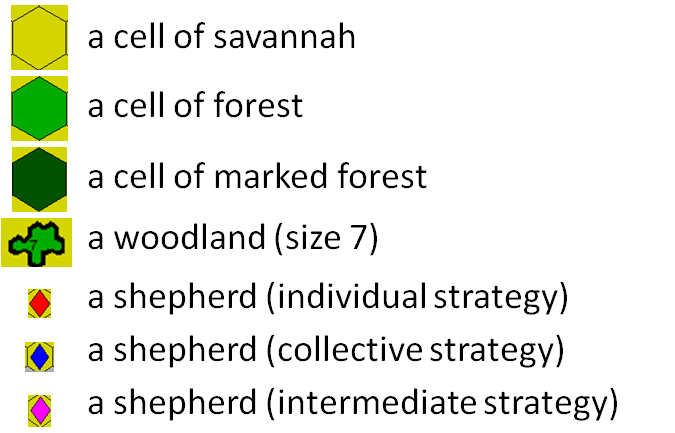
Presentation of the modelThe UML diagrams below have been created with two software ingineer tools : Vision (for the class diagram) and Rose (for the others). The UML class diagram, describing the static structure of the model in the implementation view.
The following UML sequence diagram, describing the dynamic of the model main step :
The following UML sequence diagram, describing the dynamic of the agent step :
The following UML state diagram, describing the states of the cells :
The following UML activity diagram, describing the sphepherds activities:
Some resultsThe short film (see animated gif on top) presents one simulation of 250 steps (21 years, with 1 step = 1 month), starting with a community of 40 shepherds. The periodicity to update the thresholds and to mark up the forests is 10 years. The following graphes present the evolution of the landscape and the wood lands: Evolution of the number of cells in forest
Evolution of the number of wood lands (agregates of forest)
Evolution of the mean size of the wood lands
Map of the landscape at step 2000 (months)
ReferencesBonnefoy, J.-L., Le Page, C., Rouchier, J. et Bousquet,
F., 2000. Modelling spatial practices and social representations of space
using Bonnefoy, J.-L., Bousquet, F. et Rouchier, J., 2001. Modélisation
d'une interaction individus, espace, société par les systèmes For more information, contact P. Bommel or C. Le Page. Download the model: version for Cormas2002 or version for Cormas 2013.
|
 (in dark green, the marked forests)